Posts

Showing posts from January, 2018

Cambiamenti climatici in viticoltura

Image
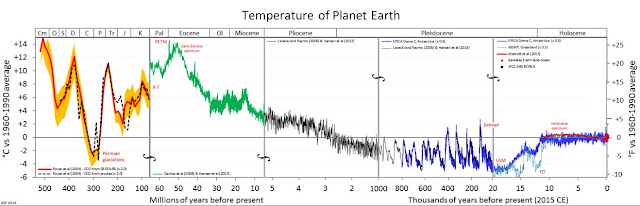
(Questo post è una sintesi delle relazioni presentate dal Dott. Luigi Lombardi del Museo Lombardo di Storia dell'Agricoltura presentate tra l'altro a Vinitaly) La vite (vitis vinifera) ha un'età tra i 130 e i 200 milioni di anni mentre la viticoltura ha circa 6000-8000 anni. Qui si analizza la temperatura da 600milioni di anni fa fino all'era moderna con riferimento alla temperatura media tra il 1960 e il 1990. Si nota una grande variabilità delle temperature e si ricorda che 5 milioni di anni fa l'area di San Gimignano era coperta dalle acque, come evidenziano anche i fossili che si ritrovano nelle vigne. Molto interessante l'analisi del livello del mare in Sardegna (Italia): l'attuale livello è 8 metri inferiore di quello di 125000 anni fa quando la CO2 era pari a 290ppm contro gli attuali 395ppm. Questo evidenzia come le pianure italiane possano essere in pericolo con un ritorno del mare al livello precedente. Il periodo di maggior interesse pe

2017 weather summary and comparison

Image
2017 temperature:  it is easy to see that winter was cold with min temp below 0°C, most of all April had an unusual decreasing of the min temp with frost and big damages in vineyard. med temp were high and so the max temp until the end of August (dry summer), then decreased in fall. 2017 rain: starting from April to the end of August we had very low rain that is the main reason of the low production in 2017. The total rain of the year is 551mm Comparison of the mean temperature of the last 3 years. 2017 had lower temp in January but higher in March, this is the reason of the early budding, then summer was dry with higher temp than usual from May to August, this is another factor for low production. 2017 min temperature: higher temp in March and lower in April are the reason of the frost damages, June and July had low temp with a big difference from max and min temp, very good for quality. 2017 max temp: high temp in March was the main reason for the early b

2017 December weather

Image
Daily temperature Max-Med-Min [°C] highest temp= 16,9 °C ( 62,4°F ) lowest temp= -3,7 °C( 25,3°F ) mean temp= 6,6 °C( 44,0°F ) mean of the max=12,5°C( 54,5°F ) mean of the min=2,5°C( 36,4°F ) Max temperature difference = 18,2°C Mean temperature difference = 10,0°C Daily rain [mm] Mean rain=2,47mm Total rain= 76,6 mm Daily umidity Max - Med - Min Mean umidity=83% Mean of the min=38% Mean Solar Radiation [W/m2] Mean value=51 W/m2